
Analyzing Key Financial Indicators: Expense Ratios
- Contributor
- Nathan B. Davis
Aug 25, 2026
Financial stewardship is at the heart of responsible church leadership. Leaders routinely monitor expenses against budget, review credit card transactions, oversee capital improvement projects, and approve invoices to ensure resources are used wisely. In addition to these important practices, church leaders should also pay close attention to key expense ratios, an often-underutilized tool for assessing financial performance and sustainability.
We’ve previously explored the importance of monitoring cash flow, debt, and income ratios and measurements. Here, we delve into why monitoring expense ratios is important and how to interpret them, using examples from the CRI CapinCrouse Church Financial Health Index.
Why Should Churches Monitor Expense Ratios?
Reviewing and analyzing expense ratios is vital for understanding spending patterns and identifying areas where your church may need to make adjustments. These ratios can help leaders recognize when costs are increasing faster than expected and evaluate whether resources are being allocated effectively. They can also help leaders determine if corrective action is needed, such as reducing discretionary spending, postponing capital purchases, or restructuring ministry expenses. Without consistent monitoring, churches can unintentionally allow expenses to outpace available resources, creating unnecessary financial strain.
Expense ratios should be considered alongside other measures of financial performance rather than in isolation. Reviewing factors such as cash flow, debt levels, income trends, and expenditures together can provide a more complete picture of the church’s financial position and support informed decision-making and faithful stewardship of church resources.
Personnel to Cash Expenditures
The personnel to cash expenditures ratio compares personnel expenses to total cash expenditures. Personnel expenses include all salaries and benefits for employees, including any outsourced employees. Many churches are moving toward outsourcing functions such as custodial services, information technology, accounting, and human resources. These should be included in your calculation of this ratio.
Additionally, cash expenditures should include mandatory required debt principal payments during the year, but not depreciation expense. While the national benchmark is set at 40% – 55%, certain regions may be at the high or low end of that range.
Ratios often tell different stories depending on the underlying trends. To illustrate how these metrics can vary, let’s review several sample ratios with distinct patterns and outcomes, and explore what they might reveal about each hypothetical church.

Sample Church #1 fluctuates above and below the 40% base. Generally, this church pays on the lower end of the wage scale. It is likely to experience higher turnover and more unfilled positions, which may have contributed to the decrease in expenses in 2022 and 2023. This could put undue pressure on remaining staff to take on additional roles and responsibilities to keep the ministry going.
Another possible explanation for this decrease is that the church took out a one- to two-year line of credit to fund a capital project, thereby increasing debt payments. This church might also be in a lower-income part of the country and within the salary range for its geographical area.
Sample Church #2 has been increasing its personnel expenses and is now well above the top-end benchmark of 55%. Generally, Sample Church #2 is a top-paying employer. It might also be expanding and hiring to support anticipated growth, which increases personnel expenses.
Another, less positive, cause could be that a reduction in giving and church attendance led the church to cut programs to offset a smaller budget. The church may not want to reduce its workforce, but it may be necessary to maintain operations. Finally, Sample Church #2 might be in a more expensive area of the country and want to offer competitive compensation.
Sample Church #3 has consistently remained within the benchmark over the last five years. This suggests the church has effectively balanced fair employee compensation with responsible overall spending and is maintaining a steady pattern.
Cash Expenditures per Giving Unit
Total cash expenditures per giving unit should be viewed alongside total contributions per giving unit, which we cover in our income ratios article. We have included both ratios below for reference.
Note that these examples look only at contributions and do not include other sources of church income, such as investment, rental, event, and program income.

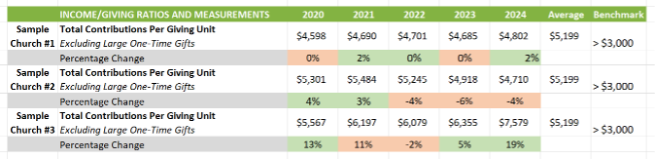
Sample Church #1 had lower contributions than cash expenditures per giving unit in 2022 and 2023, but this shifted to positive in 2024. It is important for this church to understand why. Did the church take out a one- to two-year line of credit for a capital project, thereby increasing debt payments? Did they cut expenses in 2024 to return to a positive position?
Sample Church #2 has consistently spent more per giving unit than it brings in from total contributions per giving unit. The church might be using other revenue sources to offset this, or it could be ramping up programs, opening new campuses, and expanding to new areas, which would require significant capital investments. However, the church should investigate this overage and ensure it is not heading toward cash flow issues.
Sample Church #3 is in a strong financial position, with contributions per giving unit far outpacing expenditures. This ratio does not raise concerns.
Using Expense Ratios at Your Church
Expense ratios are critical indicators of a church’s financial health and operational sustainability. Regularly monitoring these metrics can help your church identify shifts in spending, evaluate resource allocation, and ensure expenses remain aligned with ministry priorities. Armed with this insight, your leaders can make data-driven decisions, manage financial risk, and steward resources effectively in support of the church’s mission and long-term goals.
The CRI CapinCrouse Church Financial Health Index provides essential church ratios, including key expense ratios, and CRI CapinCrouse clients receive free, unlimited access. Contact us to learn more or to discuss how we can support your church.