
Analyzing Key Financial Indicators: Income Ratios
- Contributor
- Nathan B. Davis
Apr 15, 2026
Periods of market volatility and economic uncertainty can create additional challenges for churches, particularly when it comes to member giving patterns. To manage this well, it’s essential for churches to monitor giving levels consistently throughout the year to avoid surprises and review trends over the past five years to support informed, mission-aligned decisions.
This article is part of our series on financial ratios that provide clarity on your church’s financial health, including cash flow, debt, and expense ratios and measurements. Here, we explain how to analyze income ratios, using examples from the CRI CapinCrouse Church Financial Health Index.
Why Should Churches Monitor Income Ratios?
Reviewing and analyzing income ratios is essential for understanding future cash flow and identifying areas where your church may need to adjust, such as by scaling back certain ministries, delaying new programs, or pausing hiring decisions. Without consistent monitoring, churches can unexpectedly find themselves in a cash crunch.
It’s also important to evaluate income ratios within the broader context of your church’s overall financial health. Rather than focusing on a single metric, review all key indicators — such as cash flow, liquidity, and expenditures — together to gain a more accurate and meaningful picture of your financial position.
Net Income Ratio
The net income ratio compares the change in net assets without donor restrictions to total revenue without restrictions. The benchmark is straightforward: the ratio should be positive. A negative ratio indicates that the church had a decline in net assets without restrictions during the year.
Let’s look at some sample ratios with very different results and trends, and examine what this may indicate for each hypothetical church.

From 2020 to 2021, Sample Church #1 experienced a negative net income ratio, indicating a decrease in net assets without restriction. However, this was intentional, as the church invested reserves to launch a new campus and expand programming. Once the new campus investment was complete, Sample Church #1 started to see a turnaround in its net assets without restrictions, as expected.
Sample Church #2’s trend is more concerning, as the net income ratio continues to decline. A deeper look at other ratios would reveal that the church is losing members and key donors, resulting in lower giving levels. Because leadership did not recognize this quickly and delayed reducing expenses, the church has spent a significant portion of its reserves in the last two years. While cost reductions have begun, the response may have come too late.
Sample Church #3 is within the recommended benchmark across all years shown. The church continues to have a strong increase in net assets without restrictions and operates well below its means. Even after opening a new campus in 2023, the church did not dip into the red.
As these examples show, the trends, benchmarks, and peer information within the ratios reveal more than numbers. You can analyze the data to gain significant insight and determine where to investigate further.
Total Contributions per Giving Unit
This ratio measures total contributions per giving unit, excluding large one-time gifts. It helps assess ongoing member engagement, since contributions typically increase as members become more involved with the church.
The benchmark for this section is greater than $3,000. This was determined based on our experience with our church clients nationwide. Let’s look at our examples again:
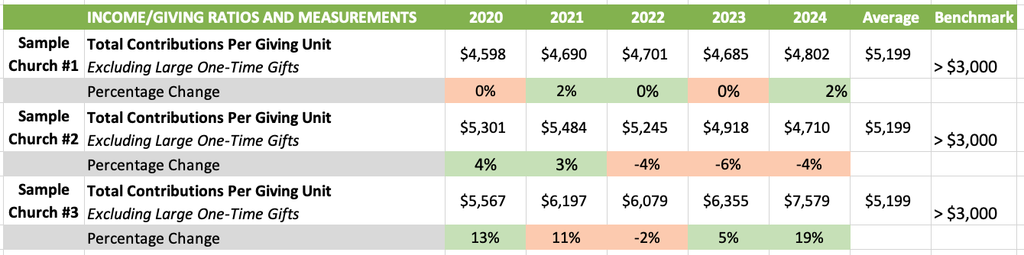
At Sample Church #1, total contributions per giving have remained fairly steady over the five years shown, which is a very positive metric for this church. As mentioned above, Sample Church #1 opened a new campus in an urban part of town, and the church is seeing significant growth and community engagement from that campus. While this has not translated into higher giving levels, it has resulted in more people reached. Increased contributions at Sample Church #1’s broadcast campus have helped offset this gap.
Sample Church #2 continues to see declining contributions per giving unit, driven by the departure of large donors and decreased engagement from some members. This trend reinforces the need for timely action and intentional engagement strategies.
Sample Church #3 has seen an overall increase in contributions per giving unit over the last five years. As the church continues to expand and open new campuses, it is seeing immediate engagement reflected in giving. This ratio indicates that the church is in a strong, healthy position.
The ratio results raise very different questions for these three churches, underscoring the need for thoughtful analysis.
The Importance of Monitoring Income Ratios
Monitoring your church’s income ratios can help ensure you aren’t caught off guard by shifts within your membership or donor base. A clear understanding of these metrics will empower your executive leadership team to make informed financial decisions that advance your mission. By regularly analyzing these ratios, you can also identify potential issues early, guiding your leadership toward wise, proactive stewardship.
If you are interested in measuring and benchmarking your church’s financial health but aren’t sure where to begin, contact us to learn more about the CRI CapinCrouse Church Financial Health Index. This convenient tool helps churches analyze their financial strengths and challenges, uncover trends, and gain practical insight to inform future decisions.